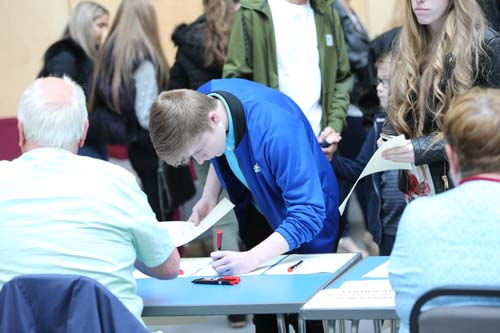
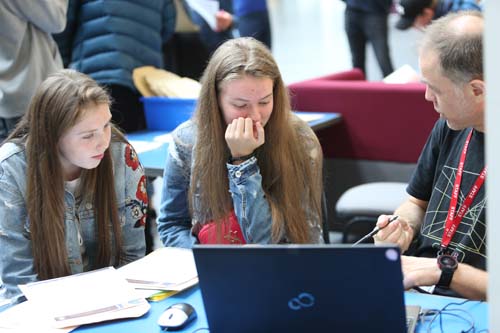
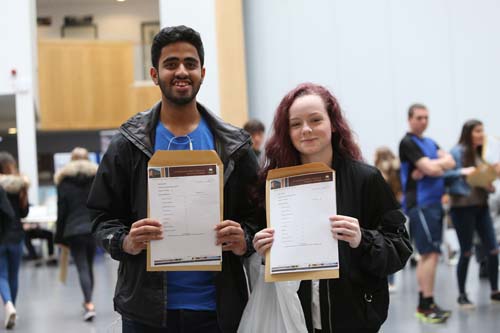
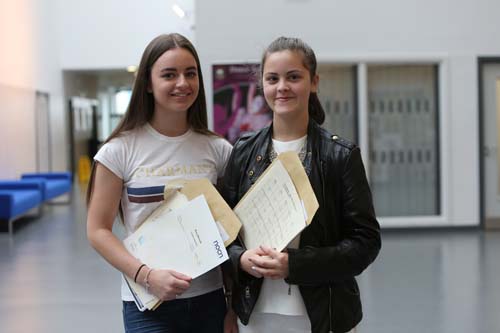
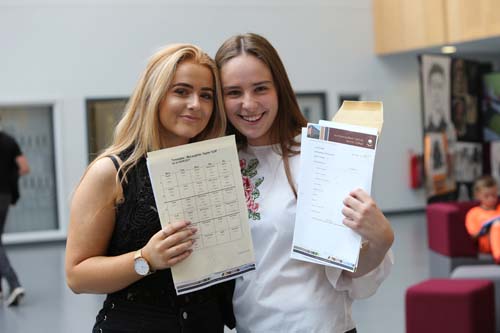
GCSE RESULTS 2017
Key Stage 4
| Number of pupils at the end of key stage 4 | 171 |
| Number of key stage 4 pupils who are non-mobile | 167 |
| % of key stage 4 pupils who are non-mobile | 98% |
| Number of disadvantaged pupils | 63 |
| % of disadvantaged pupils | 37% |
| Number of pupils with SEN without statements or EHC plan (SEN support) | 22 |
| % of pupils with SEN without statements or EHC plan (SEN support) | 13% |
| Progress 8 | -0.37 |
| Progress 8 lower confidence interval | -0.58 |
| Progress 8 upper confidence interval | -0.2 |
| Number of pupils included in the Progress 8 score | 169 |
| % of pupils included in the Progress 8 score | 99% |
GCSE and equivalent achievements of pupils at the end of KS4
| % entering the English Baccalaureate | 46.80% |
| % achieving a strong pass in the English Baccalaureate (grade 5 or above in English/maths & grade C unreformed subjects) | 20% |
| % achieving a standard pass in the English Baccalaureate (grade 4 or above in English/ maths & grade C or above in unreformed subjects). Please note that this is an additional measure and will not be published in October. | 23% |
| % achieving a strong pass in English and maths (grade 5 or above) | 31% |
| % achieving a standard pass in English and maths (grade 4 or above) | 57% |
| % entering more than one language | 0% |
| % entering three single sciences | 0% |
2016-17 9-1 Grades
| Name | Total Grades | 9 | 8 | 7 | 6 | 5 | 4 | 3 | 2 | 1 | F | X | U |
| English Language | 170 | 4 | 7 | 7 | 19 | 32 | 35 | 43 | 16 | 4 | 0 | 0 | 3 |
| English Literature | 169 | 1 | 7 | 8 | 23 | 32 | 30 | 32 | 18 | 13 | 0 | 0 | 5 |
| Mathematics | 171 | 0 | 7 | 8 | 15 | 41 | 45 | 21 | 22 | 10 | 0 | 2 | 0 |
2016-17 A*G
| Name | Total Grades | A* | A | B | C | D | E | F | G | U | |||
| Art & Design | 25 | 2 | 1 | 6 | 14 | 2 | 0 | 0 | 0 | 0 | |||
| Computer Science | 18 | 0 | 0 | 2 | 4 | 5 | 6 | 1 | 0 | 0 | |||
| Dance | 26 | 1 | 10 | 9 | 5 | 1 | 0 | 0 | 0 | 0 | |||
| DT Fashion & Clothing | 32 | 0 | 4 | 10 | 13 | 5 | 0 | 0 | 0 | 0 | |||
| DT Food | 27 | 0 | 0 | 3 | 10 | 7 | 7 | 0 | 0 | 0 | |||
| DT Product Design | 23 | 0 | 1 | 2 | 4 | 8 | 5 | 3 | 0 | 0 | |||
| Geography | 68 | 2 | 3 | 3 | 14 | 17 | 11 | 16 | 1 | 1 | |||
| History | 121 | 1 | 5 | 6 | 24 | 23 | 25 | 20 | 14 | 3 | |||
| Media Studies | 18 | 0 | 1 | 3 | 6 | 6 | 2 | 0 | 0 | 0 | |||
| Music | 7 | 0 | 1 | 1 | 5 | 0 | 0 | 0 | 0 | 0 | |||
| PE | 95 | 0 | 2 | 12 | 32 | 36 | 13 | 0 | 0 | 0 | |||
| RE | 130 | 2 | 9 | 31 | 35 | 15 | 23 | 11 | 2 | 2 | |||
| Russian | 1 | 0 | 1 | 0 | 0 | 0 | 0 | 0 | 0 | 0 | |||
| Science Additional | 118 | 1 | 15 | 30 | 36 | 16 | 16 | 4 | 0 | 0 | |||
| Science Core | 171 | 0 | 16 | 27 | 53 | 40 | 29 | 4 | 1 | 1 | |||
| Spanish | 97 | 5 | 5 | 15 | 42 | 28 | 2 | 0 | 0 | 0 |
2016-17 BTEC
| Name | Total Grades | D* | D | M | P | L1P | U | ||||||
| Business Studies | 61 | 8 | 11 | 26 | 16 | 0 | 0 | ||||||
| ECDL | 67 | 0 | 43 | 21 | 3 | 0 | 0 | ||||||
| Functional English Level 1 | 1 | 0 | 0 | 0 | 0 | 0 | 1 | ||||||
| ICT | 23 | 0 | 3 | 20 | 0 | 0 | 0 | ||||||
| Travel & Tourism | 9 | 0 | 1 | 4 | 2 | 2 | 0 |
Post 16 Value Added – 2016-17- A Level
| Value added score | 0.25 |
| Lower confidence limit | 0.11 |
| Upper confidence limit | 0.39 |
| Number of A Level entries | 238 |
Academic
| Value added score | 0.25 |
| Lower confidence limit | 0.11 |
| Upper confidence limit | 0.39 |
| Number of A Level entries | 238 |
Applied General
| Value added score | 0.05 |
| Lower confidence limit | -0.19 |
| Upper confidence limit | 0.29 |
| Number of A Level entries | 107 |
| Qualification Code | Qualification Name | Size | Cohort (A Level, academic, applied general or none) | Value added score (grades) | Lower confidence limit | Upper confidence limit | Number of entries |
|---|---|---|---|---|---|---|---|
| 111 | GCE A Level | 1 | A Level | 0.23 | 0.04 | 0.42 | 116 |
| 121 | GCE AS Level | 0.5 | A Level | -0.06 | -0.32 | 0.20 | 73 |
| 224 | Applied GCE Single Award | 1 | A Level | 0.52 | 0.23 | 0.82 | 45 |
| 225 | Applied GCE AS Level | 0.5 | A Level | 0.98 | -0.10 | 2.06 | 4 |
| 305 | BTEC Certificate Level 3 | 0.5 | Applied General | 0.30 | -0.22 | 0.81 | 26 |
| 306 | BTEC Diploma Level 3 | 2 | Applied General | -0.81 | -1.54 | -0.08 | 8 |
| 306 | BTEC Diploma Level 3 | 1 | Applied General | 0.19 | -0.09 | 0.47 | 73 |
| 699 | GCE AS Level (All) | 0.5 | None | -0.05 | -0.23 | 0.13 | 178 |
| Level 2 | VA |
|---|---|
| English | 0.28 |
| Maths | 0.17 |
| 16 to 18 performance tables figures | |
|---|---|
| Data to be published in 2017 Performance Tables (subject to inclusion of late results) | |
| Headline Measures | |
| Cohort information for students at the end of 16-18 studies | |
| Number of students at the end of 16-18 studies | 150 |
| A level cohort and results | |
| Number of students at the end of 16-18 study with an A level exam entry (for average grade measure) | 91 |
| Average point score per A level entry expressed as a grade | C+ |
| Average point score per A level entry | 31.7 |
| Applied general cohort and results | |
| Number of students at the end of 16-18 study with an applied general exam entry (for average grade measure) | 74 |
| Average point score per applied general entry expressed as a vocational grade | Dist |
| Average point score per applied general entry | 36.37 |
| Tech level cohort and results | |
| Number of students at the end of 16-18 study with a tech level exam entry (for average grade measure) | 10 |
| Average point score per tech level entry expressed as a vocational grade | Dist* |
| Average point score per tech level entry | 47 |
| English and maths progress measure | |
| Number of students at the end of 16-18 study in scope for English progress measure | 27 |
| Average progress made in English | 0.28 |
| Number of students at the end of 16-18 study in scope for maths progress measure | 55 |
| Average progress made in maths | 0.17 |
| Technical certificate cohort | |
| Number of students at the end of 16-18 study with a technical certificate exam entry (for average grade measure) | 0 |
| Average point score per technical certificate entry expressed as a vocational grade | N/A |
| Average point score per technical certificate entry | 0 |
| Level 2 vocational cohort | |
| Number of students at the end of 16-18 study with a level 2 vocational exam entry (for average grade measure) | 8 |
| Average point score per level 2 vocational entry expressed as a vocational grade | L2Merit |
| Average point score per level 2 vocational entry | 6 |
| A level attainment | |
| Number of students included in the AAB measure | 30 |
| Percentage of students who achieve three GCE A levels at grades AAB or higher, with two in facilitating subjects | 13.30% |
| Number of students included in the best three A levels measure | 33 |
| Average points per entry in best three A levels expressed as a grade | B- |
| Average point score per entry in best three A level entries | 36.16 |
| Level 3 maths attainment | |
| Number of students in level 3 maths measure | 79 |
| Percentage of students in scope of level 3 maths measure achieving approved level 3 maths | 26.60% |
| Technical certificate measure | |
| Number of students whose highest attainment is at level 2 | 6 |
| Entries | Di* | Di | M | P | L1P | U | |
|---|---|---|---|---|---|---|---|
| Bus GenCert:3 | 4 | 0 | 0 | 4 | 0 | 0 | 0 |
| Business Cer:3 | 5 | 1 | 2 | 2 | 0 | 0 | 0 |
| Health Cert:3 | 21 | 0 | 0 | 8 | 7 | 0 | 6 |
| IT Cert:3 | 9 | 0 | 0 | 6 | 1 | 0 | 2 |
| Perf Arts Cert:3 | 9 | 0 | 2 | 4 | 0 | 0 | 3 |
| Business ExC:3 | 4 | 0 | 0 | 2 | 0 | 0 | 2 |
| Business Sub:3 | 12 | 3 | 5 | 4 | 0 | 0 | 0 |
| Fashion Sub:3 | 5 | 2 | 2 | 0 | 1 | 0 | 0 |
| Health SubDip:3 | 9 | 7 | 0 | 0 | 2 | 0 | 0 |
| IT SubDip:3 | 11 | 4 | 4 | 3 | 0 | 0 | 0 |
| Science Sub:3 | 23 | 17 | 4 | 0 | 2 | 0 | 0 |
| Travel Sub Dip:3 | 9 | 7 | 2 | 0 | 0 | 0 | 0 |
| Health Dip:3 | 12 | 1 | 5 | 6 | 0 | 0 | 0 |
| Business Award:2 | 9 | 0 | 2 | 5 | 2 | 0 | 0 |
| Health Award:2 | 16 | 0 | 0 | 2 | 12 | 2 | 0 |
| Sport Award:2 | 8 | 0 | 0 | 2 | 5 | 0 | 0 |
| Travel Award:2 | 21 | 0 | 1 | 8 | 8 | 4 | 0 |
| Entries | A* | A | B | C | D | E | U | |
|---|---|---|---|---|---|---|---|---|
| Art A2 | 7 | 0 | 1 | 4 | 1 | 1 | 0 | 0 |
| Biol A2 | 8 | 1 | 2 | 0 | 1 | 2 | 2 | 0 |
| Bus A2 | 40 | 2 | 5 | 24 | 9 | 0 | 0 | 0 |
| Chem A2 | 6 | 1 | 1 | 1 | 0 | 2 | 1 | 0 |
| Danc A2 | 8 | 0 | 0 | 2 | 5 | 1 | 0 | 0 |
| Geog A2 | 1 | 1 | 0 | 0 | 0 | 0 | 0 | 0 |
| EngL A2 | 9 | 2 | 2 | 4 | 1 | 0 | 0 | 0 |
| Hist A2 | 9 | 0 | 4 | 4 | 1 | 0 | 0 | 0 |
| Maths A2 | 18 | 2 | 4 | 4 | 5 | 2 | 1 | 0 |
| Media A2 | 30 | 0 | 0 | 8 | 19 | 3 | 0 | 0 |
| PE A2 | 8 | 0 | 1 | 2 | 3 | 1 | 1 | 0 |
| Phys A2 | 3 | 0 | 1 | 0 | 1 | 1 | 0 | 0 |
| Psyc A2 | 3 | 0 | 0 | 1 | 2 | 0 | 0 | 0 |
| Span A2 | 5 | 0 | 1 | 4 | 0 | 0 | 0 | 0 |
| Art AS | 10 | 0 | 1 | 2 | 4 | 2 | 1 | 0 |
| Biol AS | 8 | 0 | 0 | 0 | 0 | 3 | 3 | 2 |
| Bus AS | 10 | 0 | 1 | 0 | 3 | 5 | 1 | 0 |
| Chem AS | 5 | 0 | 1 | 0 | 0 | 0 | 1 | 3 |
| EngL AS | 6 | 0 | 1 | 2 | 1 | 2 | 0 | 0 |
| Hist AS | 9 | 0 | 0 | 0 | 1 | 3 | 4 | 1 |
| Maths AS | 18 | 0 | 2 | 2 | 4 | 3 | 6 | 1 |
| Media AS | 26 | 0 | 0 | 2 | 12 | 9 | 3 | 0 |
| Phys AS | 5 | 0 | 1 | 0 | 0 | 2 | 1 | 1 |
| Psyc AS | 14 | 0 | 0 | 1 | 2 | 4 | 2 | 5 |
| Textiles AS | 3 | 0 | 0 | 0 | 1 | 1 | 0 | 1 |

